Reddit SEO
 Wordpress
 WooCommerce
 Shopify
 Magento
 BigCommerce
 HubSpot
 Neto
Neto
 Headless
 ChatGPT
 Gemini
Every "what to build for AI search" list puts comparison pages at the top. We looked at 1.2 million AI referral sessions across 600+ businesses and found something different. This is what we'll cover in this blog:
- What Content Formats Earn the Most AI Search Traffic?
- What Is the AI Traffic Leverage Ratio?
- Why Do Interactive Tools and Calculators Win AI Citations?
- What Makes Content "Answer-Shaped"?
- Do Comparison Pages Deserve Their Reputation in AI Search?
- Where Does AI Referral Traffic Actually Land?
- Which Content Format Is the Most Reliable?
- What Should You Build First for AI Search?
- Does the Winning Format Change by Industry?
- How We Measured This
- The Experience We've Had in AI Search
- FAQs
TL;DR
-
Interactive tools and templates earn 7.5 times their share of pages in AI referral traffic, the highest leverage of any content format we measured across the websites of 600+ businesses.
- Comparison pages, the format most often recommended for AI search, ranked 5th of 7 formats. Popular advice does not match first-party data.
- A third of all AI referral traffic lands on product and collection pages. AI assistants are already a buying channel, and your commercial pages are already in the answer set.
The content that earns the most AI search traffic per page is not a blog post at all. It is the humble calculator. Across 600+ businesses’ websites and 1,203,748 real visits referred by ChatGPT, Gemini, Perplexity, Claude and Copilot, interactive tools and templates earned 7.5 times their share of pages, the highest of any content format we measured.
Most advice about AI search is built on citation counts scraped from the outside. This study is built the other way: first-party analytics from the websites of more than 600 businesses in StudioHawk’s portfolio, measuring the AI referral visits that actually arrived.
One number runs through everything that follows: the AI Traffic Leverage Ratio. It is how we ranked every format, and it is the reason our conclusions differ from the citation-counting studies you have already seen.
What Content Formats Earn the Most AI Search Traffic?
Interactive tools, templates and calculators earn the most AI search traffic relative to their supply: 7.5 times their share of pages. How-to content follows at 5.65, definitions at 5.41, listicles at 5.09, comparison pages at 4.44, guides at 4.17 and statistics pages last at 2.52.
The table below shows every content format in the study, the number of sites publishing it, the AI referral sessions it earned, and its leverage ratio.
| Content format | Example (from our own site) | Sites with the format | AI referral sessions | Leverage ratio |
| Tools, templates & calculators | SEO ROI calculator | 217 | 1,845 | 7.54 |
| How-to content | How to rank in ChatGPT | 436 | 5,744 | 5.65 |
| Definitions and concept explainers | What is AI SEO | 303 | 2,049 | 5.41 |
| Listicles (top X, best X) | Top 5 content strategies for SaaS | 318 | 2,213 | 5.09 |
| Comparison pages (X vs Y) | Enterprise SEO vs traditional SEO | 208 | 791 | 4.44 |
| Guides | Complete guide to technical SEO | 293 | 1,919 | 4.17 |
| Statistics and data pages | Enterprise SEO statistics | 146 | 224 | 2.52 |
Source: StudioHawk Format Leverage, 600+ businesses, January to July 2026
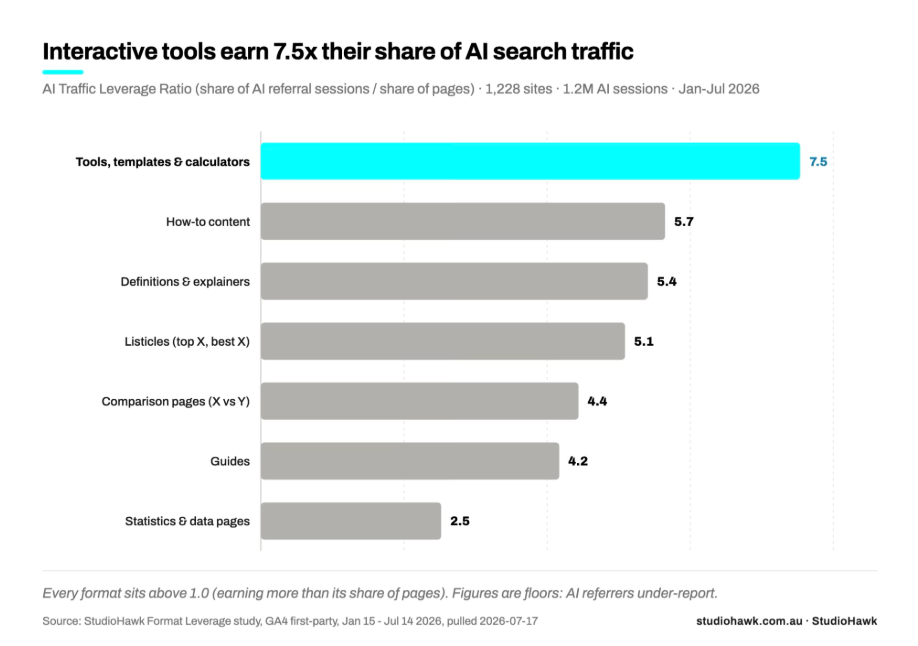
AI Traffic Leverage Ratio by content format
Two things stand out in that table. Every format sits above 1.0, meaning every content format out-earns its share of pages in AI referrals. And the spread between the top and bottom formats is threefold, which means format choice is a real lever, not a rounding error. Reading that lever correctly depends on the ratio behind the ranking.
What Is the AI Traffic Leverage Ratio?
The AI Traffic Leverage Ratio is a format’s share of AI referral traffic divided by its share of published pages. A ratio above 1.0 means the format earns more AI traffic than its page count predicts. Below 1.0 means it is oversupplied relative to what it earns.
The normalisation is the point. Raw citation or traffic counts reward whatever there is most of. Product pages earned more total AI sessions than every content format combined, but there are also vastly more of them. Divide traffic share by page share and you see what each page type earns per unit of effort.
That supply adjustment is what most AI search studies skip. Counting citations tells you what appears in answers most often. Leverage tells you what a marginal page of each format is worth, which is the question that actually decides what you build next. And what the leverage data says to build first is the format at the top of the table: the interactive tool.
Why Do Interactive Tools and Calculators Win AI Citations?
Interactive tools and calculators win because they are scarce, answer-shaped and liftable. When someone asks an assistant “how much does X cost” or “what size Y do I need”, a calculator page is the exact object that resolves the question. Most sites do not have one, so the few that exist collect outsized referrals.
Across our dataset, 217 websites had at least one tool, template or calculator page. Those pages made up a fraction of one percent of all pages we analysed, yet they earned 7.5 times their share of AI referrals.
The tools in our data are not engineering projects. The pages driving this number are cost calculators, sizing and quantity estimators, downloadable checklists and template packs: assets a content team ships in a sprint, not a quarter. Fewer than one in five websites in the study has even one. That scarcity, more than any structural trick, is the moat.
Measure your own site against the study with the calculator below. Enter a format’s page count and AI referral sessions alongside your site totals, and it returns your AI Traffic Leverage Ratio benchmarked against the 600+ business dataset.
AI traffic leverage calculator
Leverage = your format's share of AI referral sessions divided by its share of pages. Above 1.0 means the format earns more than its supply. Pull the four numbers from GA4 (sessions where the source is an AI assistant) and your CMS or crawler.
Benchmarks: StudioHawk Format Leverage study, 1,228 sites, 1.2M AI referral sessions, Jan to Jul 2026. AI referrers under-report, so treat results as floors.
What Makes Content “Answer-Shaped”?
Answer-shaped content resolves a query in one artefact: a calculator that outputs the number, a template that is the deliverable, a definition that is the answer (our explainer on what is AI SEO is that shape). The pattern holds across the top of our ranking. Tools, how-tos and definitions all package a complete answer in a single page, and all three sit above 5.4 leverage.
The formats lower on the table make the reader do the assembly. That gap between packaged answers and assembly-required content is clearest in the format everyone keeps recommending: the comparison page.
Do Comparison Pages Deserve Their Reputation in AI Search?
Comparison pages perform well, but they do not deserve top billing. At 4.44 leverage they ranked 5th of 7 content formats, behind listicles, definitions, how-tos and tools.
That result contradicts a lot of current advice. Comparison content is the most recommended AI search play of 2026, usually on the logic that “X vs Y” pages face little competition and match high-intent questions. Our first-party data says the logic is half right: comparison pages out-earn their page share, so they are worth having. It also says four other formats out-earn them per page.
“The pattern we keep seeing is programmatic: hundreds of pages built on one idea. Our data shows AI assistants reward seven different formats. One idea only ever captures one of them.” Lawrence Hitches, Chief of Staff, StudioHawk
The gap between reputation and measurement matters because teams are re-prioritising roadmaps around it. Part of the explanation sits in supply: comparison pages stopped being scarce. Two years of “build vs pages” advice produced a wave of them, and our dataset shows 208 websites in the study now publish comparison content. Scarcity is a moving target, and the formats that win leverage today are the ones most sites still have not built.
Before you re-prioritise anything, though, the next question is where AI referral traffic actually goes.
Where Does AI Referral Traffic Actually Land?
A third of all AI referral traffic lands on product and collection pages. Another 56 percent lands on homepages, service pages and other brand and entity pages. Content formats and everything else share the remaining 11 percent, with the formats themselves at about 3 percent.
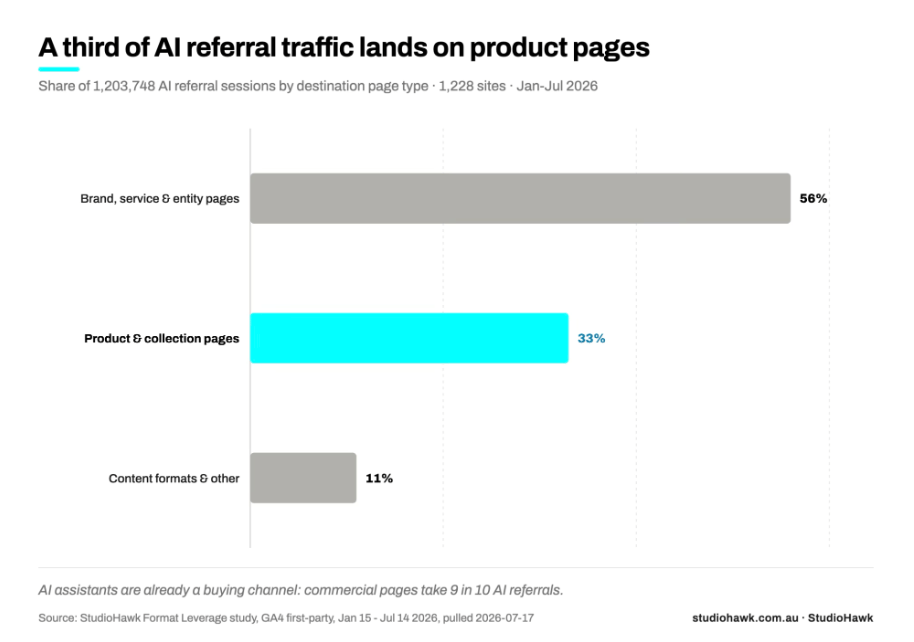
Where AI search traffic lands
Source: StudioHawk Format Leverage study, 600+ businesses, January to July 2026
Read those two numbers together and the story is blunt: AI assistants are already a buying channel. They are not just answering research questions, they are handing users directly to commercial pages. Product pages carried 2.41 leverage in our data, above break-even, which means even relative to their enormous page counts they over-earn.
For eCommerce brands this is the single most actionable finding in the study. Your product and category pages are already in the AI answer set, and ecommerce SEO fundamentals like clean product data, schema and crawlability decide how often. Commercial pages take the volume, but one content format stands out for a different reason: it never loses.
Which Content Format Is the Most Reliable?
Guides are the most reliable format in the study. We split the dataset into six sub-portfolios and re-ran the analysis on each. Guides were the only content format above break-even in all six. Every other format, including the tools at the top of the pooled table, dropped below 1.0 leverage in at least one sub-portfolio.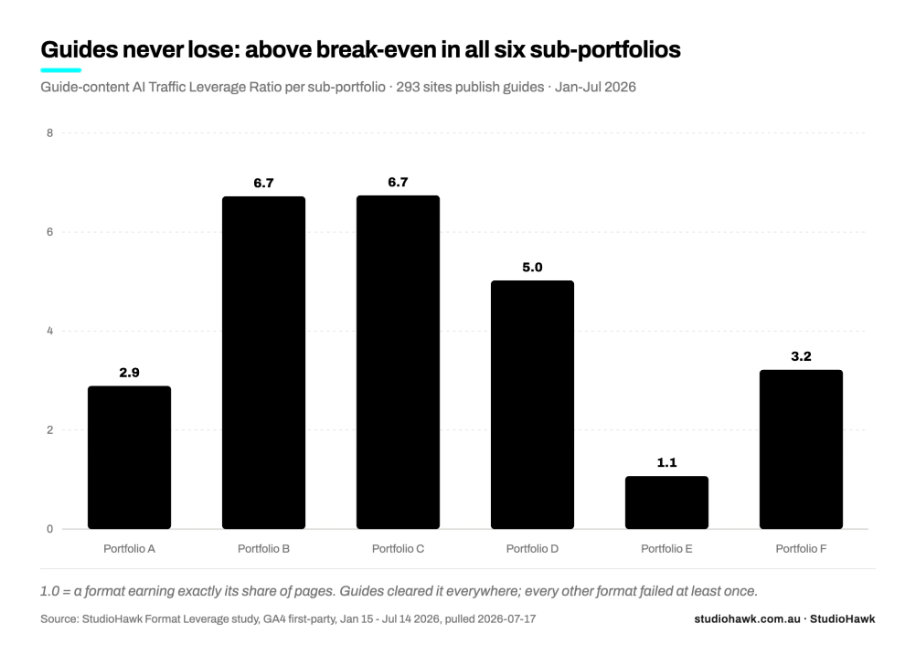
Guide leverage across six sub-portfolios
Source: StudioHawk Format Leverage study, 600+ businesses, January to July 2026
Magnitude and reliability are different bets. Tools deliver the highest ceiling; guides deliver the safest floor. A portfolio answer beats a single-format answer, which is exactly how we would build it.
What Should You Build First for AI Search?
Build an interactive tool first. Here is the full order we would build in, leading content for a brand right now:
- Ship one interactive tool this quarter. A calculator, configurator or template generator in your highest-value topic. Highest leverage in our data (7.54) and the least crowded, because most competitors do not ship tools.
- Cover your entity’s how-to and definition set completely. The workhorse formats (5.65 and 5.41 leverage) that answer the questions assistants field all day. Structure them so the answer leads, per our guide to ranking in ChatGPT.
- Keep comparison pages in the mix, proportionally. They earn 4.44 times their share. Build the matchups your buyers actually ask about, not every permutation.
- Anchor each cluster with a guide. The only format that held above break-even everywhere we looked. The safe core of a topic cluster.
- Treat commercial pages as AI surfaces. A third of AI referrals land on them. Product data quality, schema and page speed are now AI-visibility work, not justtechnical SEO hygiene.
- Deprioritise standalone statistics pages. Last place at 2.52. Yes, we see the irony: this page is one. That is why this study ships with a ranking table, three charts and a what-to-build list you can lift, rather than a wall of numbers.
How far you weigh each step depends on your industry, and that dependence turned out to be the study’s biggest surprise.
Does the Winning Format Change by Industry?
Yes, and by more than we expected. When we split the dataset into sub-portfolios, format returns swung by roughly 10 times depending on the client mix. Tools topped some segments and fell below break-even in others. Comparison pages ranged from parity to a 10.87 peak.
The pooled ranking above is the honest portfolio-wide answer, and it is also an average across industries that behave very differently. The per-industry cut, which formats win in eCommerce versus services versus B2B, is the next release in this series.
The per-vertical Format Leverage report is the next release in this series, and it feeds directly into our AI SEO service work. Our current AI search research is availablehere.
How We Measured This
-
Dataset. We took the GA4 website properties of more than 600 businesses in StudioHawk’s analytics portfolio (spanning ecommerce, services, B2B, health, legal and education), classified all 7.5 million pages into a content-format taxonomy, and measured the 1,203,748 AI referral sessions those pages earned. Many businesses run multiple websites (regional domains, apps, sub-brands); the portfolio spans current and former client properties.
- Window. 15 January to 14 July 2026. Six months, one fixed snapshot, dated and frozen.
- Sources. A session counts as AI referral traffic when its recorded source is ChatGPT, Gemini, Perplexity, Claude or Copilot. Classic Bing search traffic is excluded. Google AI Overview clicks are not separable from standard Google organic in analytics and are not counted.
- Classification. Every page was classified into a format taxonomy by a rules engine, then hand-validated on stratified samples. The classifier scored 91.7 percent format accuracy on a held-out sample of sites it had never seen. Residual errors are adjacent-format confusions, not commercial pages leaking into content buckets.
- Privacy. All figures are anonymised aggregates. No client is identifiable. No cut in this report rests on fewer than five separate websites, enforced in code.
- Limits. This is correlational, not causal: high-leverage formats attract AI traffic, and strong sites also build those formats. Figures are undercounted wherever assistants strip referrer data, so every figure here is a floor, not a ceiling. Leverage compares formats against each other on the same measurement, so the undercount does not change the ranking.
The Experience We've Had in AI Search
StudioHawk runs AI search programs across 1,000+ campaigns, from ecommerce brands tracking assistant-referred revenue to B2B firms rebuilding content clusters around answer-shaped formats. This study exists because that portfolio gave us measurement access no citation-scraping study can match.
FAQs
What content format earns the most AI search traffic?
Interactive tools, templates and calculators earn the most AI search traffic per page, at 7.5 times their share of pages across 600+ businesses’ websites in StudioHawk’s Format Leverage study. How-to content (5.65) and definitions (5.41) follow.
How do you measure AI search traffic in GA4?
AI search traffic in GA4 is measured by filtering sessions on source: chatgpt.com, gemini.google.com, perplexity.ai, claude.ai and copilot.microsoft.com referrers. Referrer stripping means the result undercounts true AI traffic, so treat any figure as a floor.
Do comparison pages work for AI search?
Comparison pages work for AI search, earning 4.44 times their share of pages in AI referrals. They ranked 5th of 7 content formats in our data, so they belong in a portfolio rather than at the top of the build order.
How much traffic do AI assistants send to websites?
Across the websites of 600+ businesses over six months, AI assistants referred 1.2 million sessions, with a third landing on product and collection pages. Figures are undercounted wherever assistants strip referrer data, so treat them as floors.
Know what your leverage ratio is? Get in touch for a chat here.