Can’t find your site in Google search results?
Google Search Console shows what’s working, what’s broken, and how to fix it.
It's free and built by Google.
This guide breaks down how to use its tools to track performance, spot issues, and make smarter SEO and AI Search decisions. Here's an overview of what we'll cover in this guide:
- TL;DR What Does Google Search Console Do?
- What Is Google Search Console?
- How to Verify Website Ownership in Google Search Console
- Key Features of Google Search Console
- Using Google Search Console for SEO
- Advanced Features of Google Search Console
- Levelling Up Your Search Console
- Final Word
- FAQs
TL;DR: What Does Google Search Console Do?
Google Search Console gives you real-time data on how your site appears in search.You can track issues, fix problems, and improve visibility.
How to Use It
- Strategy: Base decisions on real data queries, clicks, rankings, and crawl info.
- Research: Find weak pages, missing keywords, and traffic patterns by filtering data by country, device, or search query.
- Content: Improve titles, descriptions, and page copy on pages that already rank or get clicks.
- Authority: Check who's linking to you. Use this to guide backlink audits and link-building.
- Technical: Fix crawl errors, submit sitemaps, and keep mobile usability in check.
- Measurement: Track clicks, impressions, and ranking shifts over time. Link to Google Analytics for user data.
When used consistently, Search Console becomes your go-to tool for keeping your SEO sharp.
What Is Google Search Console (GSC)?
Google Search Console (GSC) is a free tool from Google that helps site owners track search performance, fix indexing issues, and monitor site health.
It provides reports on impressions, clicks, indexing status, links, and Core Web Vitals.
Users can submit sitemaps, remove URLs, inspect specific pages, and receive alerts about crawl errors or performance issues.
GSC stores up to 16 months of data but only starts collecting after verifying ownership of the site.
Getting Started with Google Search Console
To use Google Search Console, you need to set up an account, verify your domain, and connect it to Google Analytics for full search performance tracking. Here’s how to do it.
How to Create a Google Search Console Account
- Go to the Google Search Console homepage.
- Click Start Now.
- Sign in with your Google account. Use your business account if possible.
- Click Add Property in the top-left dropdown.
- Enter your website’s full URL. Don’t include “https://” or a trailing slash.
- Click Continue to start verifying ownership.
.png?width=765&height=605&name=Verfication%20Step%20(2).png)
Why Verification Matters
Google needs proof that you own or manage the site. Once verified, you can link Search Console to Google Analytics for more detailed insights. This helps track how users find your site and which pages perform best.
Next up: how site verification works in detail.
How to Verify Website Ownership in Google Search Console
After setting up your account, you’ll need to prove you own the site. This unlocks access to performance data and tools. There are several ways to verify:
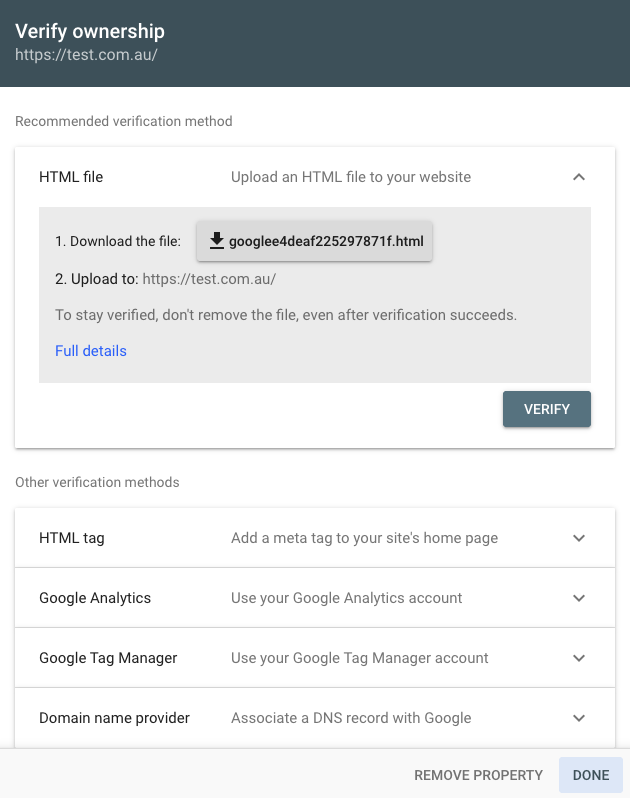
- HTML File Upload: Download a file from Google and upload it to your site’s root directory. This confirms you have access to the server.
- HTML Tag: Copy a meta tag from Google and paste it into the section of your homepage.
- Domain Name Provider: Choose your registrar from the list and add a DNS TXT record. This proves you control the domain.
- Google Tag Manager: If you already use Tag Manager, you can verify without adding code or files, just connect with the same account.
Each method checks you have the right access. Choose one that matches how your site is set up.
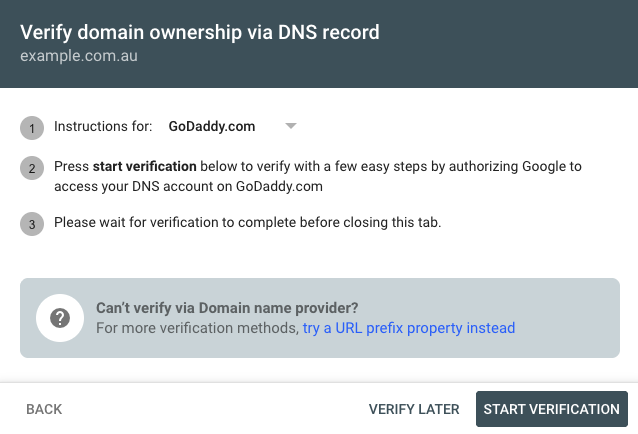
Once verified, you’ll get full access to Search Console features.
How to Link Google Search Console with Google Analytics
Connecting the two gives you a better view of how users find and interact with your site. Here's how to do it:- Sign in to Google Analytics.
- Select the property you want to connect.
- Click Admin (bottom-left corner).
- Under the Property column, click All Products.
- Find Search Console, then click Link Search Console.
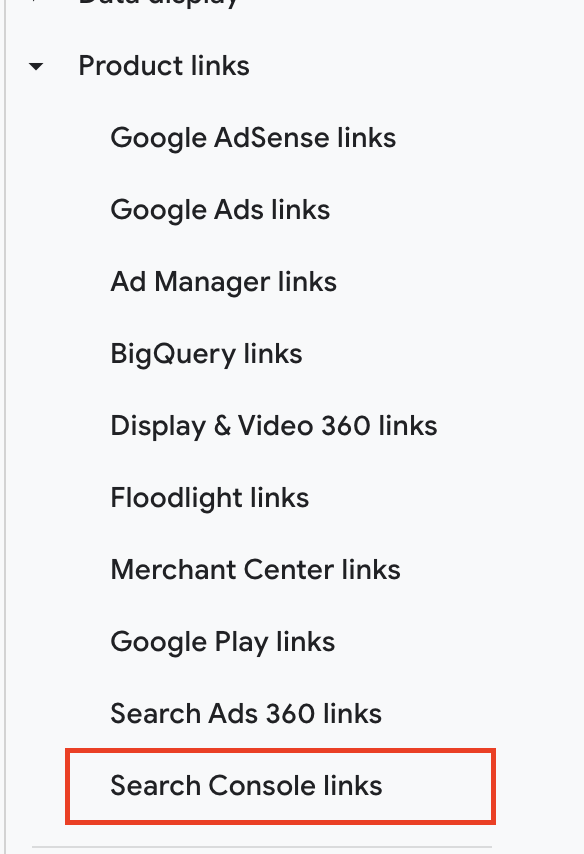
- Choose the verified site you want to link. If it’s missing, verify it in the Search Console first.
- Click Continue, then Associate.
Once linked, you’ll see search data (like queries and impressions) directly in Analytics. This helps you match search behaviour with user engagement, useful for SEO, AI search optimisation, content updates, and campaigns.
Key Features of Google Search Console
Google Search Console shows how Google sees your site. It helps you:- Track search performance: See clicks, impressions, average position, and CTR.
- Inspect URLs: Check indexing status, coverage issues, and crawl data for any page.
- Fix technical issues: Spot crawl errors, check robots.txt, mobile usability problems, and structured data issues.
It’s built for SEO work, quick checks, fast fixes, and clear data.
Basically how your website appears on the SERPs.
For SEO specialists, it’s a critical tool for data based decision making.
How can I monitor website crawling with Google Search Console?
Go to the Coverage tab to see how Googlebot crawls your site. This shows which pages are indexed, excluded, or have errors.
Click on any issue to see more detailed things like 404s, server errors, or blocked URLs.
Use the URL Inspection Tool to check if a specific page is crawlable and indexed. You can also request re-crawling after updates.
Regular crawl checks help keep key pages visible in search.
How do I identify indexing issues in Google Search Console?
The Coverage page shows indexing status across your site. It flags:- Errors: pages that couldn’t be indexed (like 404s or server issues)
- Valid pages: properly indexed content
- Warnings: pages that may need attention
- Excluded pages: URLs that were intentionally or unintentionally left out
Use the URL Inspection Tool for more detail on a specific URL and to request re-indexing.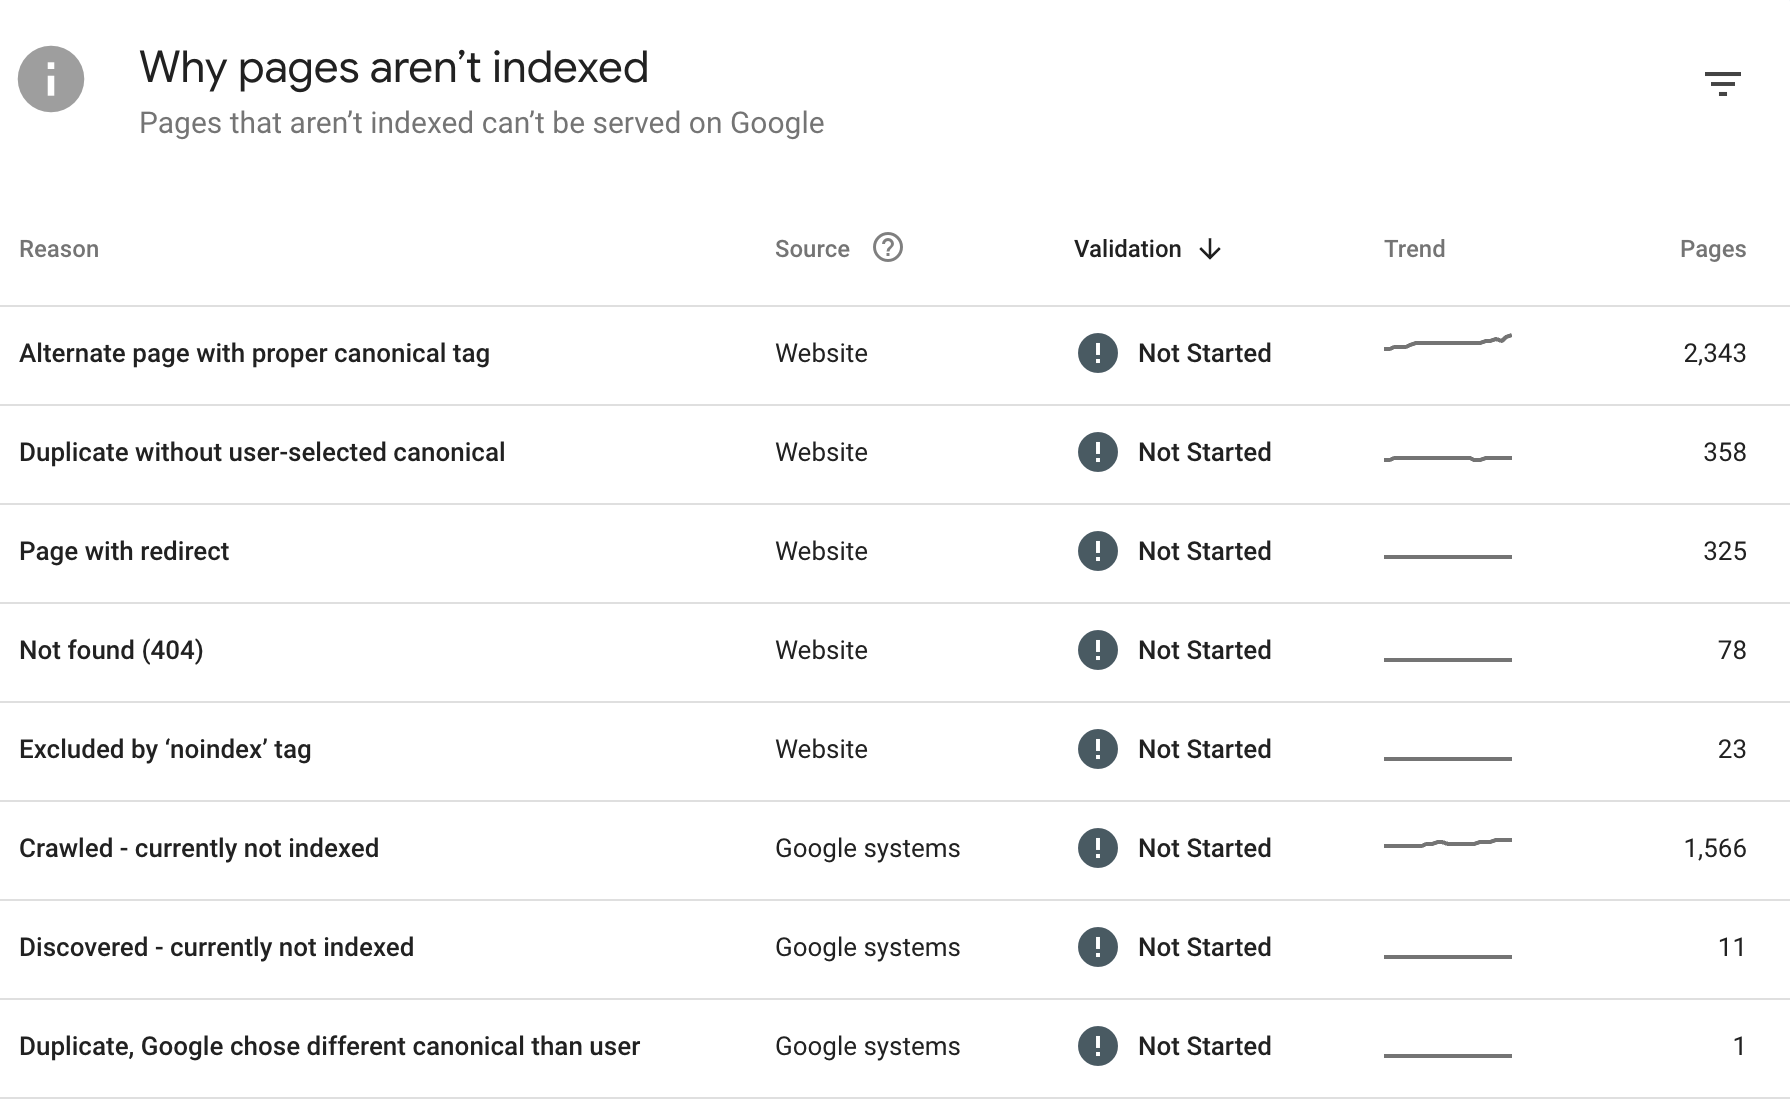
Fixing these issues keeps your site searchable and technically healthy.
How do I access traffic data in Google Search Console?
Use the Performance report to view search traffic data. You’ll see:- Clicks: how many times users clicked your site
- Impressions: how often your site appeared in search
- CTR: the click-through rate from impressions
- Average position: your ranking in search results
Filter by query, page, country, or device to analyse what’s working and where to improve. Use this insight to refine content and metadata.
How can I understand backlinks using Google Search Console?
The Links tab shows which sites link to yours. You can track:- External links: who links to you and how often
- Top linked pages: which URLs get the most links
- Anchor text: what words other sites use in links
- Internal links: how you’ve linked pages within your own site
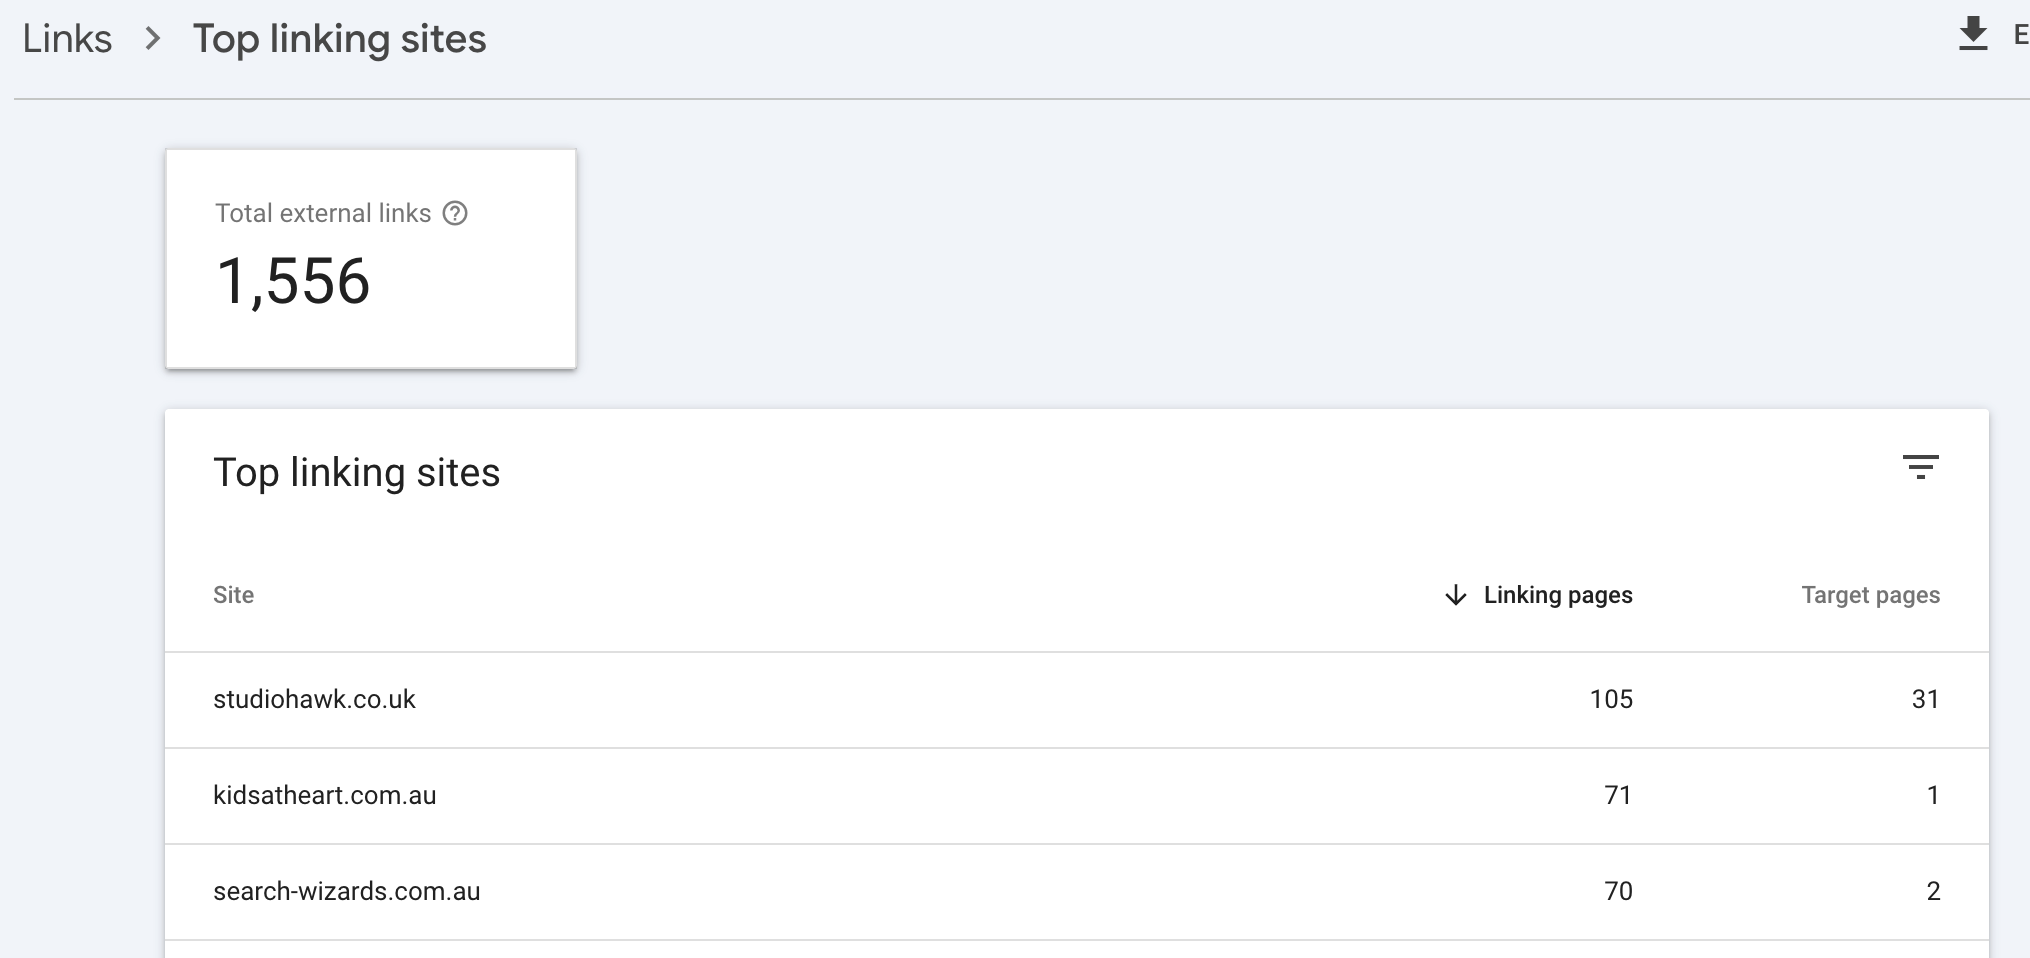
Use this data to find strong backlink sources, identify spam, and improve your internal link structure.
Using Google Search Console for SEO
Google Search Console gives you the data you need to improve rankings and traffic. It shows keyword performance, backlinks, indexing status, and moreall straight from Google.
How do I view keywords and performance metrics?
Go to the Performance tab to track how your site appears in search. You’ll see:- Queries people used to find your site
- Clicks, impressions, CTR, and average ranking for each keyword
- A graph of total clicks and impressions over time
Use filters to view performance by page, country, device, or search appearance.
This helps you spot high-performing pages, featured snippets, or low-CTR queries worth fixing.
How do I analyse interactions and rankings?
Use the graph in the Performance tab to track clicks and impressions over time.
This shows how users interact with your site through search.
Check the Average Position metric to see where your pages rank. Combine this with CTR data to find content that ranks but doesn’t convert then fix titles or descriptions.
Apply filters by page or keyword to narrow in on what’s working or not for keyword research.
How do I index pages and manage sitemaps?
To help Google find and index your content:- Go to the Sitemaps tab and submit your sitemap URL.
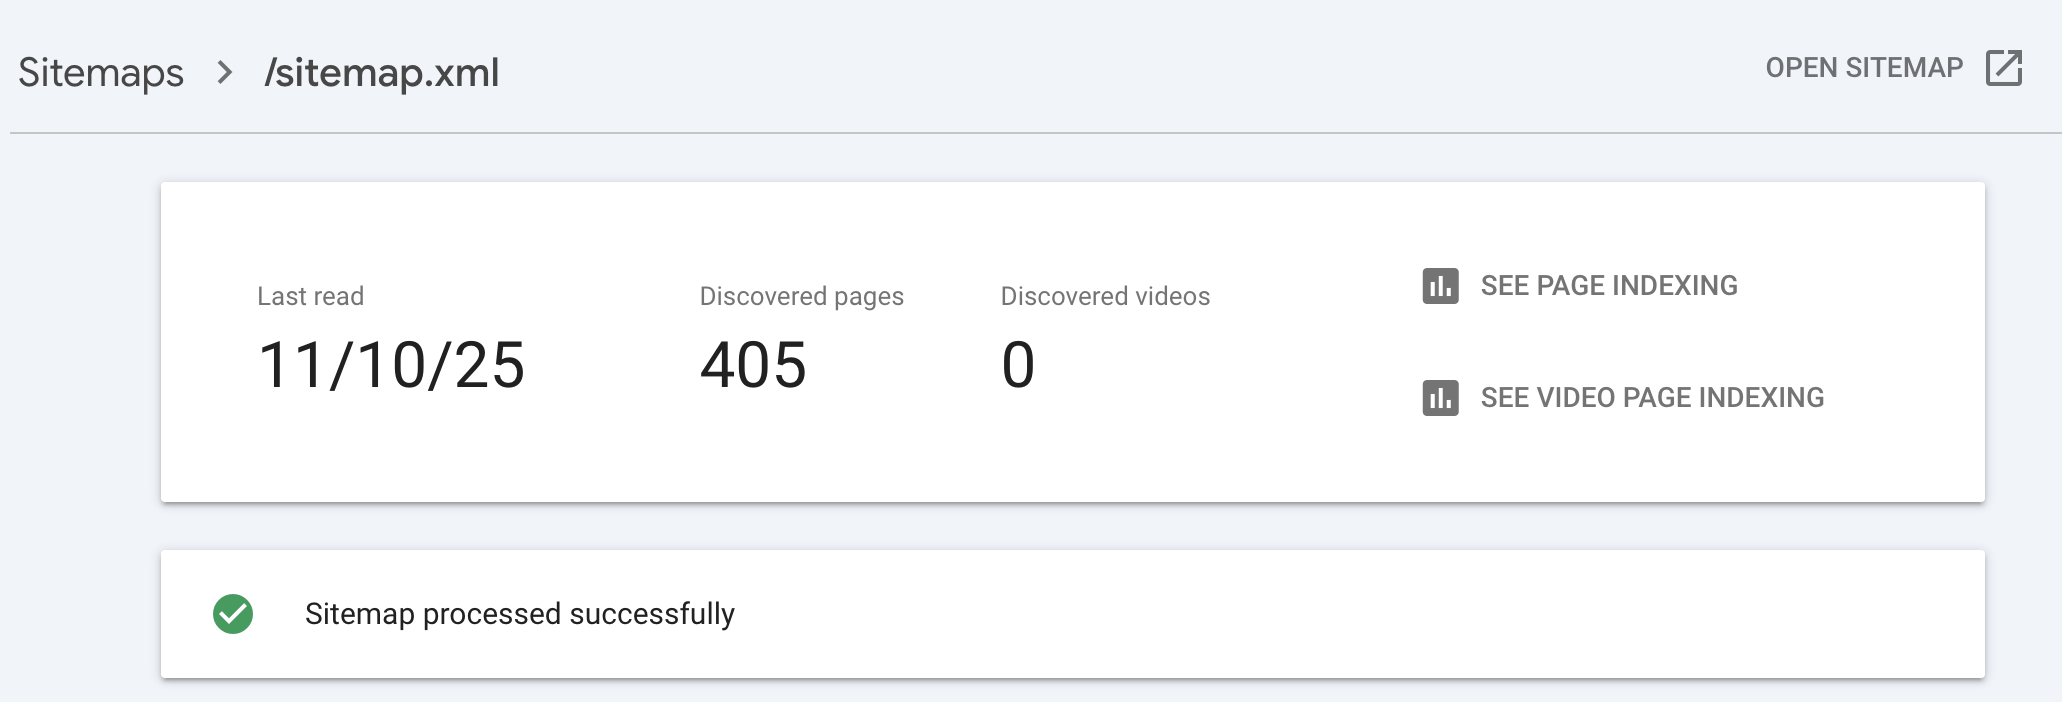
- Use the Coverage page to check which pages are indexed.
- For unindexed pages, use the URL Inspection Tool and click Request Indexing.
- Monitor the Index Coverage report for errors like broken links or redirects.
- Keep your sitemap up to date, remove old pages, add new ones.
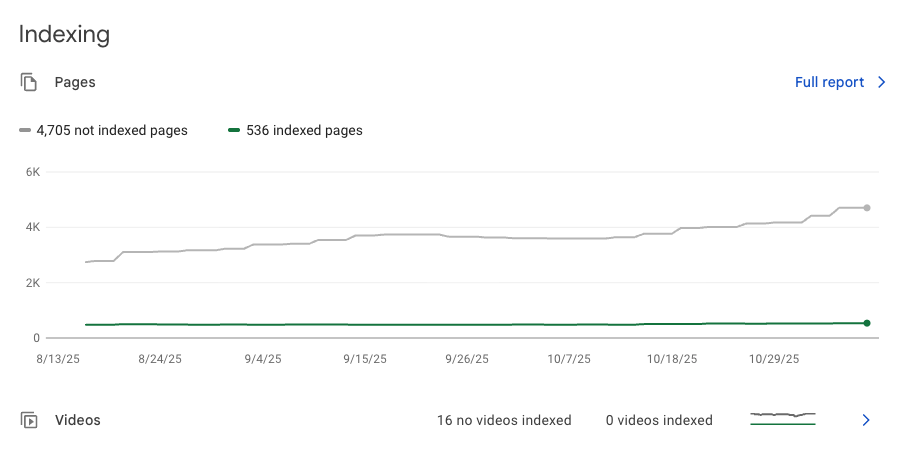
This keeps your content discoverable in search and helps Google crawl your site efficiently.
How can I identify potential penalties using Google Search Console?
Open the Security & Manual Actions tab to check for manual penalties. These might include:- Unnatural backlinks
- Keyword stuffing
- Spammy or low-quality content
If your site is hit, fix the issues listed. Then submit a reconsideration request once resolved.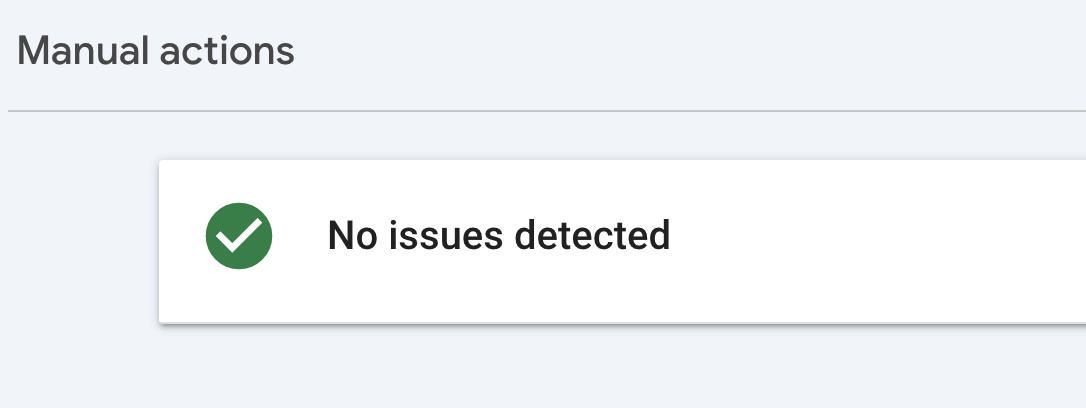
Ignoring penalties can tank your rankings. Fixing them quickly can restore your traffic within weeks.
Advanced Features of Google Search Console
Google Search Console flags technical SEO problems quickly. Use built-in reports to catch mobile issues, indexing gaps, penalties, and more.
How do I check for penalties and security issues?
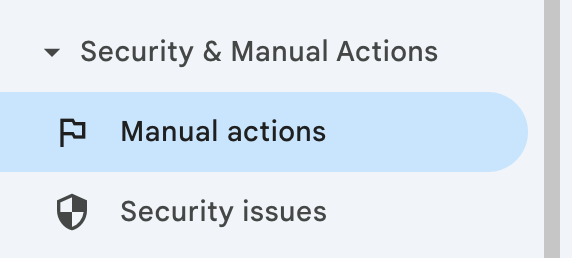
Go to the Security & Manual Actions tab. This shows:- Manual actions: applied by Google reviewers for violations like hidden text or spammy markup
- Security issues: such as hacked content or unsafe downloads
Check this section often. If a penalty appears, you’ll get details and steps to fix it. Address issues fast to limit ranking drops and avoid long-term traffic loss.
How can I ensure mobile usability?
Open the Mobile Usability tab to spot mobile-specific problems. Common errors include:- Text too small to read
- Clickable elements too close together
- Content wider than screen
- Core Web Vitals
- Image sizes and alt text
- Load times across mobile browsers
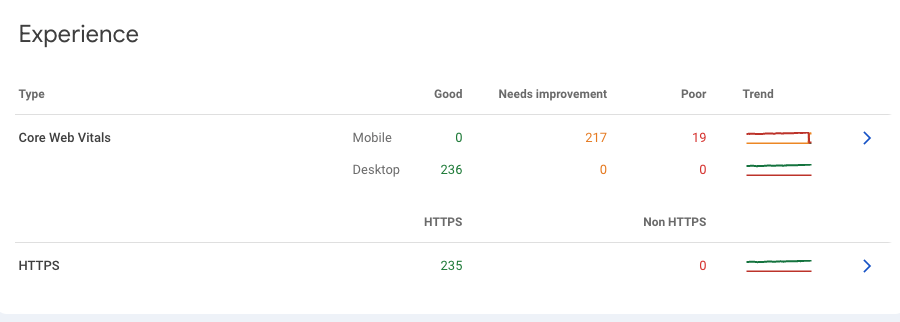
After changes, use the URL Inspection Tool to test mobile performance page by page.
How do I identify high-traffic pages?
In the Performance tab, switch to Page view to see traffic per URL. You'll get:- Clicks
- Impressions
- CTR per page
Use the Date filter to view up to 12 months of data. This helps spot seasonal trends or content that’s lost momentum.
Focus on top-click pages when updating meta tags, fixing page speed, or adding structured data.
How do I monitor Click-Through Rate (CTR) and impressions?
Still in the Performance tab, use the graph to compare:- CTR: how often people click your listing
- Impressions: how often it appears in search
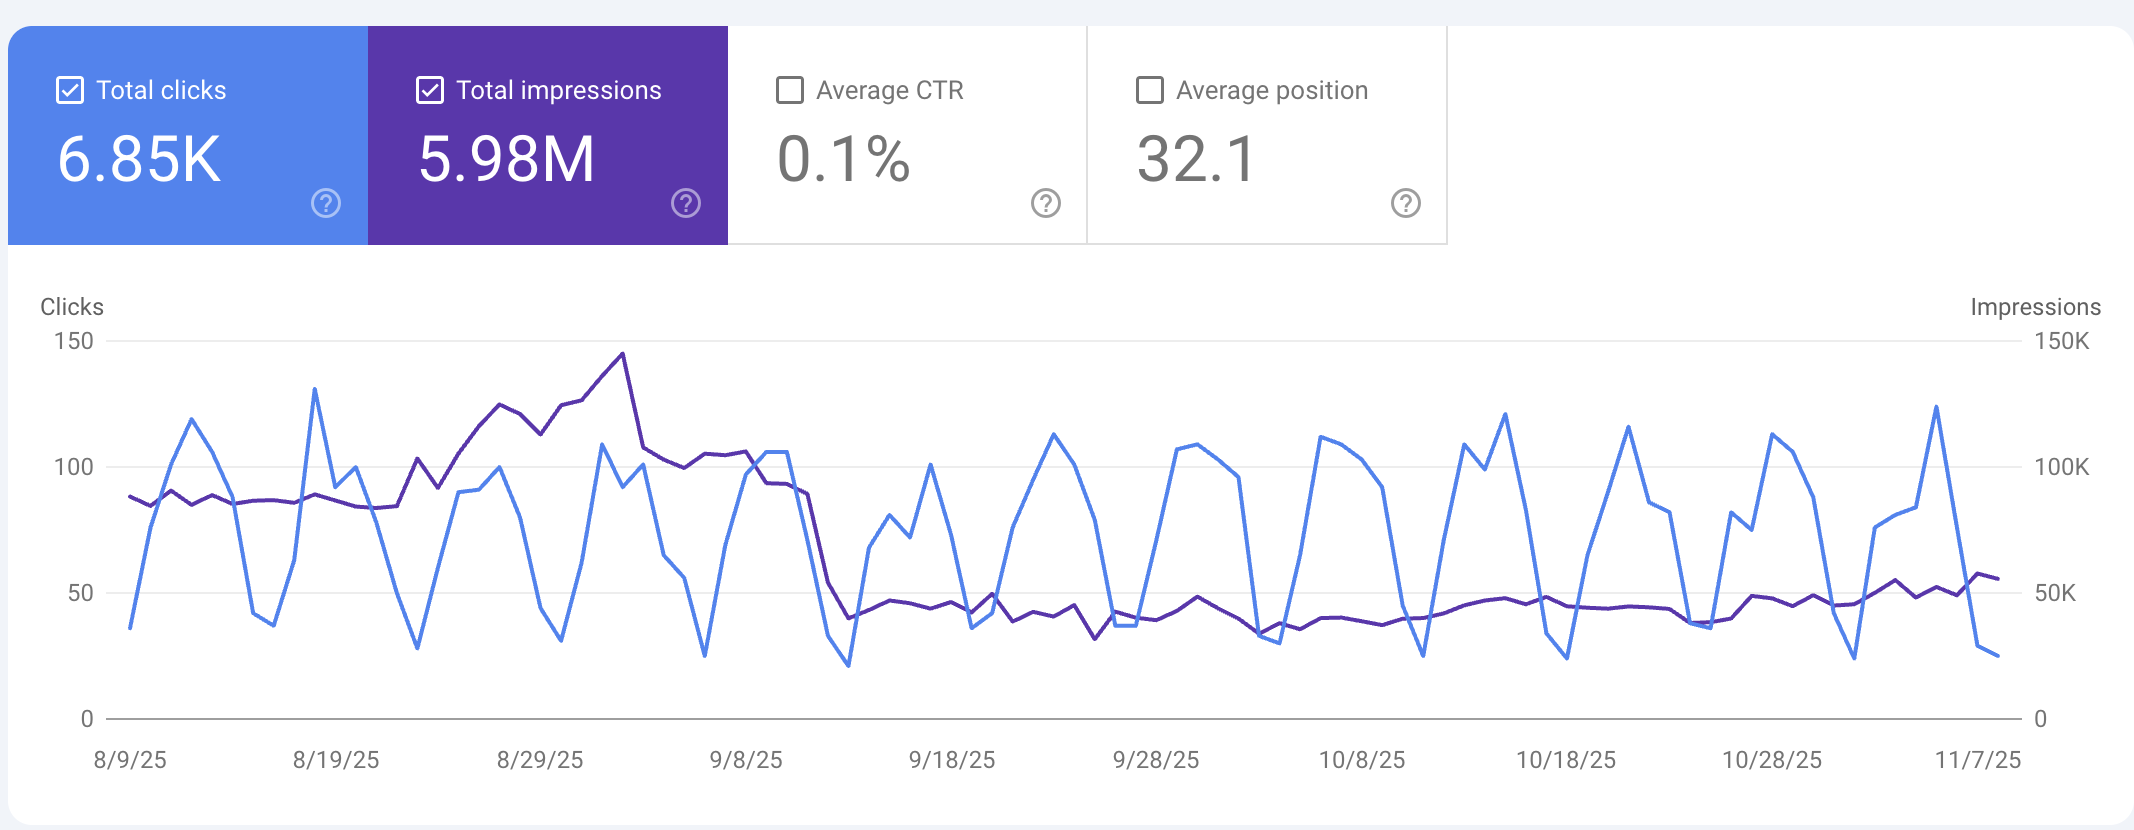
- High impressions but low CTR = your listing isn’t compelling enough
- High CTR but few impressions = good targeting, but low reach
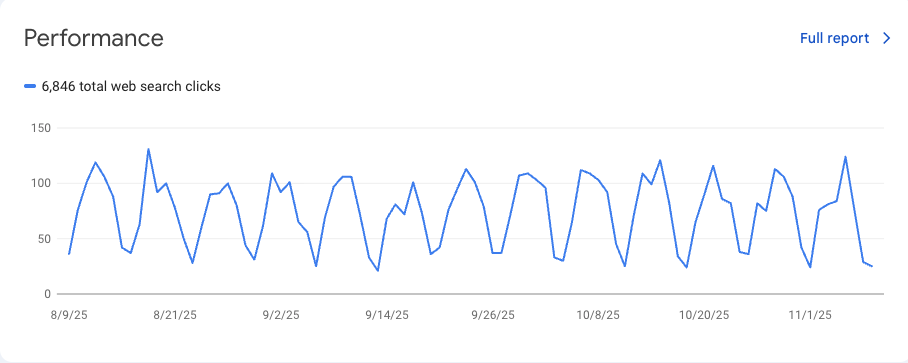
Aim to improve both. Refine titles, meta descriptions, and schema to make listings more clickable.
How do I track AMP (Accelerated Mobile Pages) errors?
Go to the AMP section and set the filter to Error. You'll see:- A list of AMP-related issues
- A breakdown of affected pages
- Details to help troubleshoot fast
Fixing AMP issues improves mobile speed and can help search rankings. This is especially useful if you publish content-heavy pages for mobile users.
Levelling Up Your Search Console
Once you’ve covered the basics, there are a couple of smart add-ons that make Google Search Console even more useful.SEOTesting
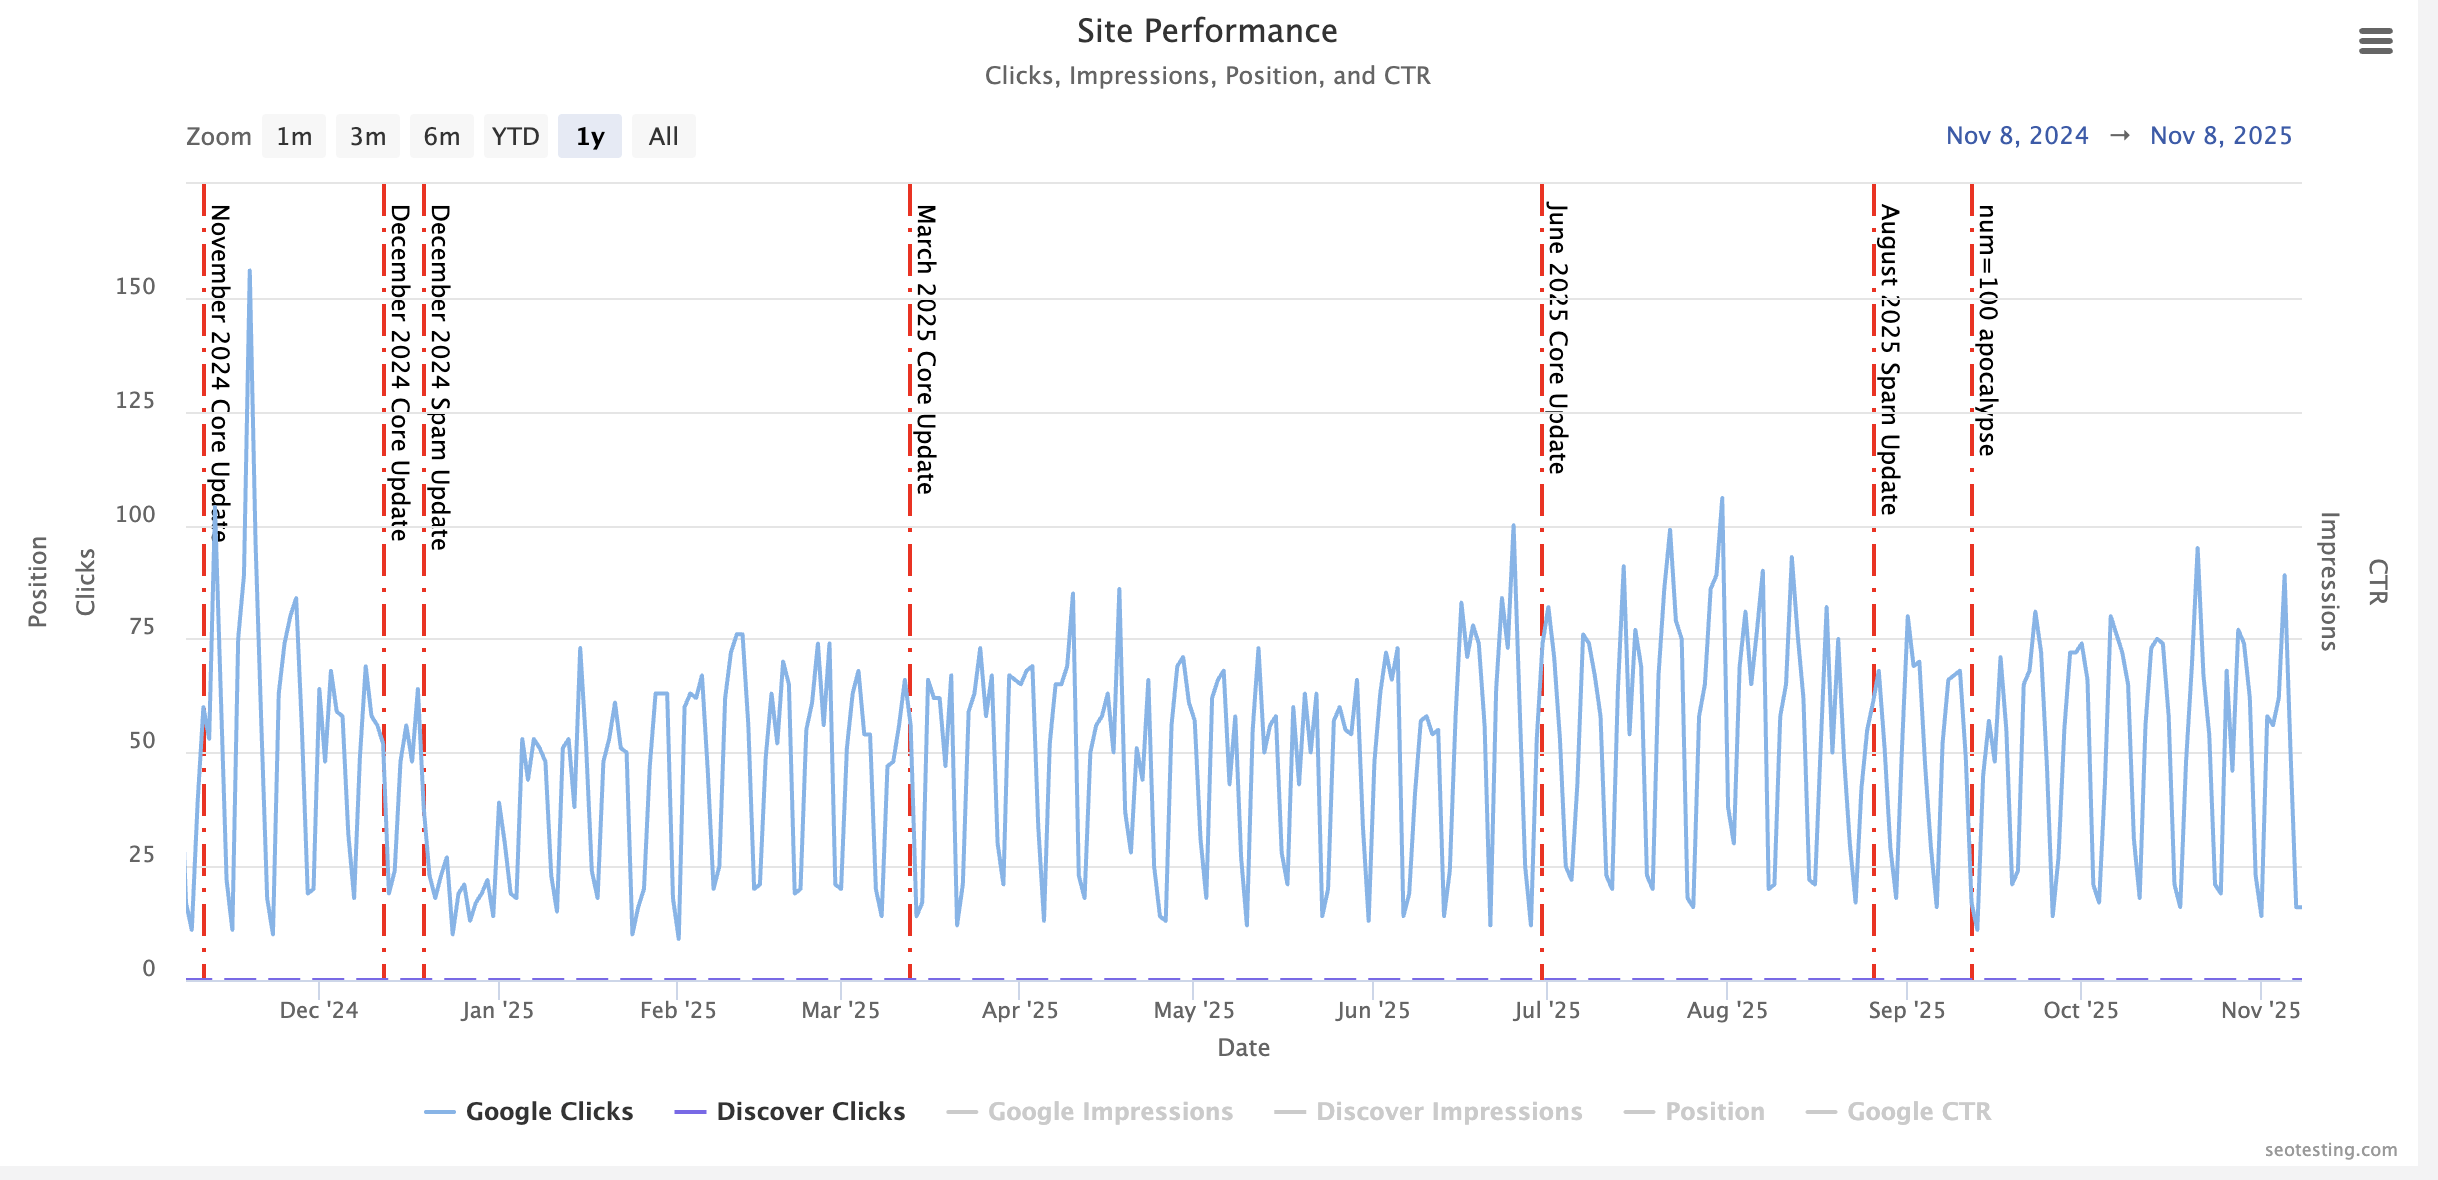
SEOtesting lets you test SEO changes with real data. You can:- Run experiments like title or content updates and measure the results
- Track performance over time with charts and dashboards
- Set up alerts and overlays for algorithm updates
SEO Gets
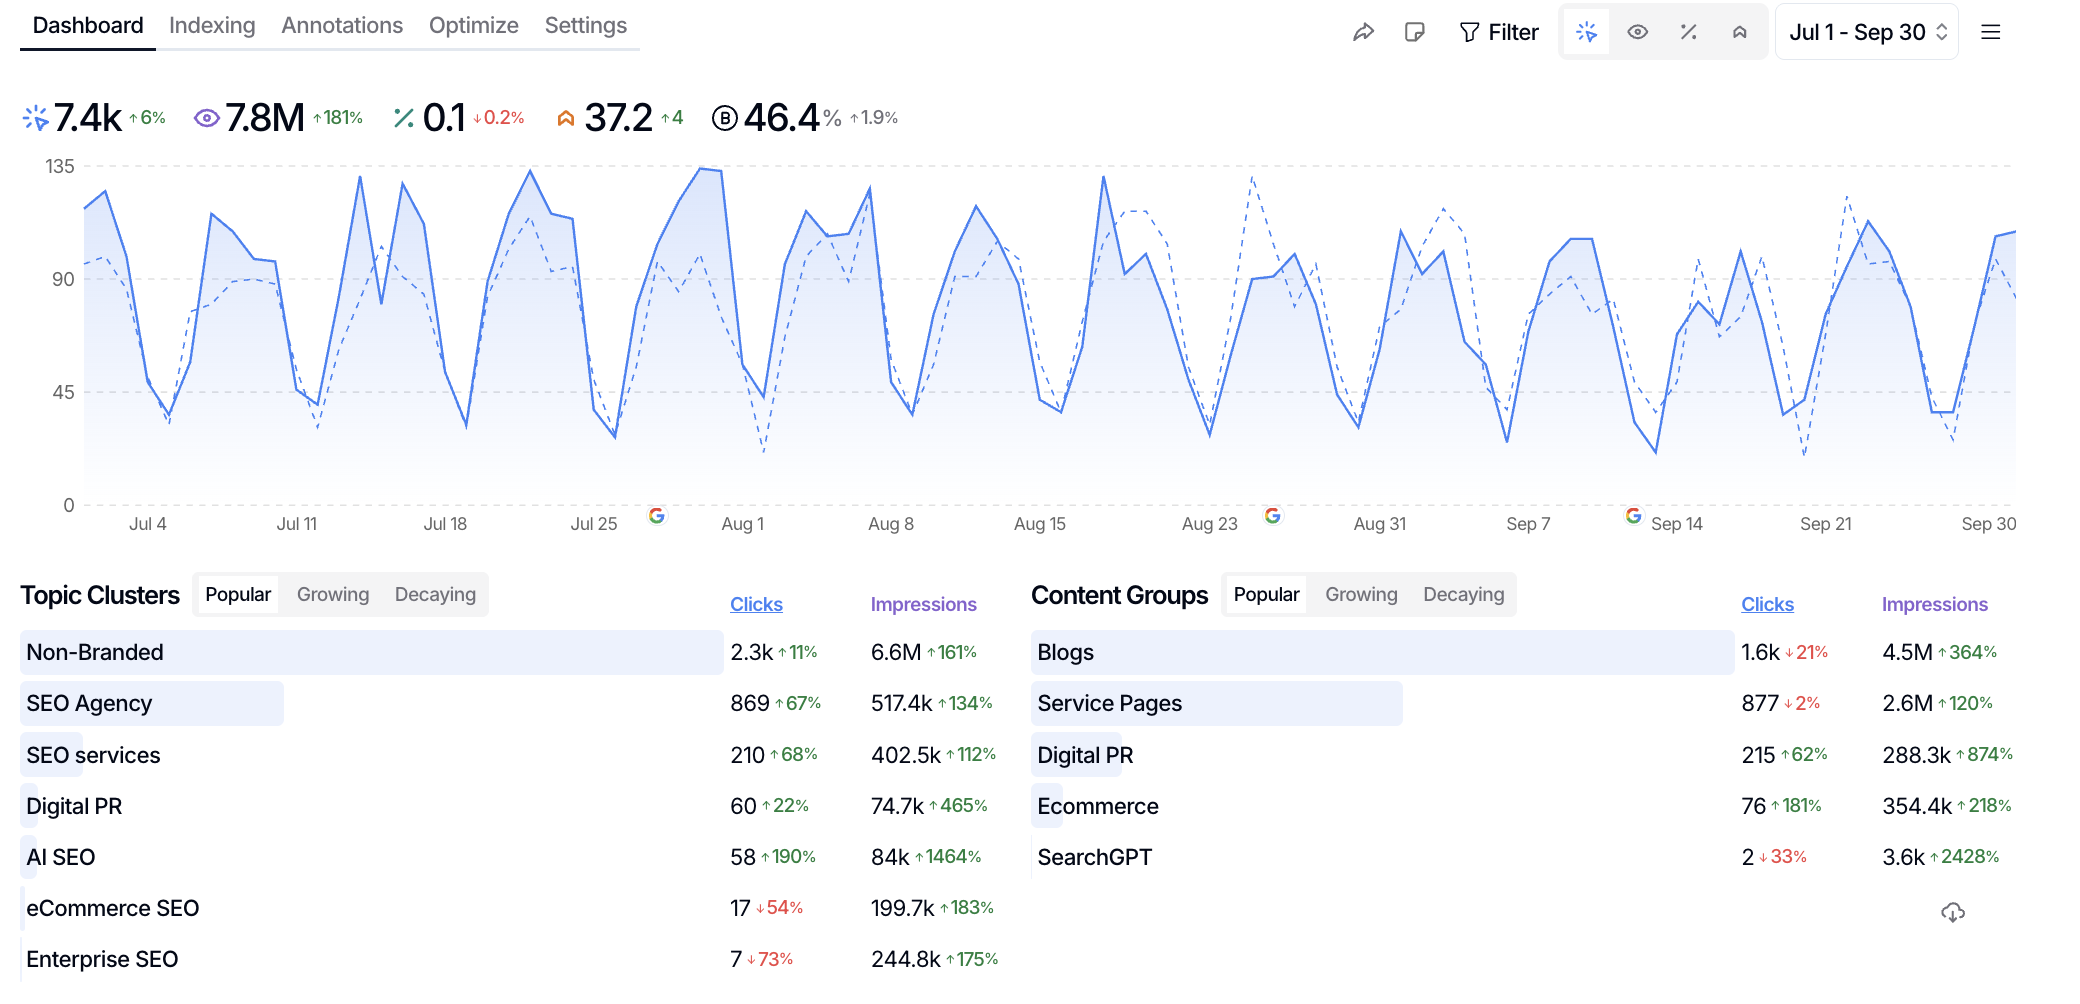
SEO Gets pulls more out of your GSC data:- Filter by branded vs non-branded keywords
- Group content by topic or page type
- Export up to 50k rows at once
- Manage unlimited sites from one dashboard
Which One?
- Use SEOTesting to validate site changes and optimise page updates with confidence.
- Use SEO Gets to access more keyword data and get a better view across all your sites.
Both tools plug straight into Google Search Console.
I’ve used them on dozens of client projects, these have gone from useful add-ons to essential tools in the day-to-day SEO toolkit.
Final Word
Google Search Console is essential for SEO. It helps you monitor site health, fix crawl errors, and track search performance, all using real data, directly from Google.
Connect it to Google Analytics for deeper insights into user behaviour. Use it regularly to catch mobile issues, spot penalties, and make sure your content stays visible in search.
FAQs
1. What is Google Search Console?
It’s a free tool from Google that shows how your site performs in search. It provides data on keyword rankings, indexing status, crawl errors, and page performance.
2. Is Google Search Console free to use?
Yes. It’s a completely free service from Google for anyone who owns or manages a website.
3. How do I access Google Search Console?
Go to search.google.com/search-console and sign in with your Google account. Then add and verify your site to start viewing data.
4. How do I use Google Search Console for SEO?
You can use it to monitor rankings, submit sitemaps, fix crawl errors, and find pages with low CTR. The Performance tab helps you track which keywords drive traffic.
5. What is ‘Average Position’ in Google Search Console?
This shows the average ranking of your pages in search results for each query. A lower number (e.g. 3) means higher visibility.
6. What does CTR mean in Search Console?
CTR (Click-Through Rate) is the percentage of users who saw your site in search results and clicked on it. It’s calculated as clicks divided by impressions.
7. How do I find keywords in Google Search Console?
Open the Performance tab. You’ll see a list of queries your site ranks for, along with clicks, impressions, CTR, and position.
8. Can I track backlinks in Google Search Console?
Yes. Go to the Links section to see external sites linking to you, top linked pages, and anchor text used.
9. What is the Coverage report?
The Coverage report shows which pages Google has indexed, which are excluded, and if there are errors like 404s or redirects.
10. How do I submit a sitemap to Google Search Console?
Click the Sitemaps tab, enter your sitemap URL (usually sitemap.xml), and hit submit. This XML sitemap helps Google find and index your pages faster.
11. What is a Property in Search Console?
A Property is a site or domain you’ve added to Search Console. You can track performance, indexing, and other metrics for each property.
12. Why does Search Console show ‘no data’?
This often happens if the site is new, the property isn’t verified properly, or there’s little to no traffic. Wait a few days after verification or check site visibility.
13. What’s the difference between clicks and impressions?
Impressions mean your site appeared in search. Clicks mean someone actually clicked on your listing. High impressions with low clicks often means your title or description needs work.
14. Can I see Google Ads data in Search Console?
No. For AdWords/Ads data, use Google Ads or link Search Console with Google Analytics for a more complete view.
